
Several map makers create maps purporting to forecast fall color. Few do it accurately.
On California Fall Color, what you see is what you get. We only post what has been observed, as reported to us by a network of some 100 volunteer “color spotters.”
That takes time and patience, but it is accurate. You can trust that what we report is peaking, truly is. We only report what is being seen and base any forecast on actual current observations and documented historical record.
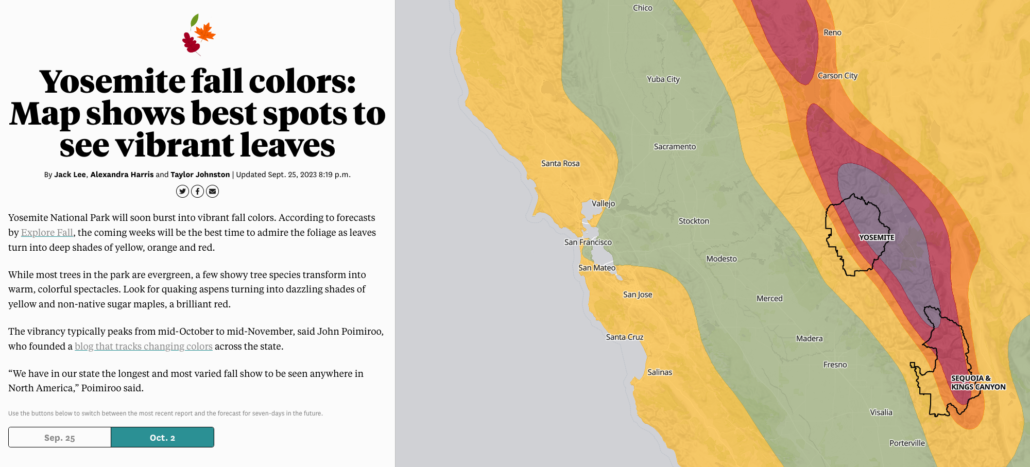
Explore Fall, a new autumn-centric website has created a computer model based on “gridded temperature, precipitation and daylight data” that they claim is “accurate within three days, 80% of the time.” However, the map they provided to the San Francisco Chronicle today wasn’t 10% accurate within 30 days.
Yosemite will not begin showing fall color until the first to second week of October, when a non-native Eastern sugar maple peaks near the Yosemite Chapel (last year, this lone tree peaked on Oct. 4). A week or two later, bigleaf maple and dogwood will begin coloring yellow and pink along the banks of the Merced River and will peak in late October.
Yosemite Valley’s show will culminate in November, when deep-orange black oak flame out among its meadows.
Yet, Explore Fall forecasts Yosemite to peak on Oct 2 and that the Eastern Sierra will be past peak by then. Nonsense.
Such guesses aren’t even close to what really happens. Computer models may be useful in other locales where fall color is unpredictable, but to forecast when and where color will peak anywhere in California, combine what CFC.com is now reporting with past reports (see “Reports By” at right).
The combination of current observation with what happened in prior years provides the most accurate way to find glorious fall color in The Golden State.
Though we love technology in California, we also know its limitations. Forecasting fall color is one of them. You need people on the ground to know when and where it will peak.


For anyone interested, in preparation for a Fall Camping trip to the Sierra this October, I went through CFC posts to estimate when several areas peaked the past 5 years (2018-2022). I went based on date of “Go Now” posts, or if there were no “Go Now” posts for a location in any given year, I added a week to “75%” or subtracted a few days/week from “You Missed It” posts.
I’m no statistician (I barely passed Stats 101 in college, lol!). But it at least gives an idea of the rough, general window for planning your trips. All dates are chronological 2018-2022, followed by the average.
Here’s what I found:
Bishop Creek: 10/13, 10/7, 10/3, 10/2, 10/7 = Average 10/6
Upper Rock Creek: 10/9, 10/10, 10/3, 10/2, 10/4 = Avg: 10/6
Convict Lake: 10/24, 10/17, 10/20, 10/20, 10/19 = Avg: 10/20
McGee Creek: 10/14, 10/10, 10/15, 10/20, 10/15 = Avg: 10/15
Mammoth Lakes: 10/10, 10/1, 10/20, 10/12, 10/14 = Avg: 10/11
June Lake: 10/17, 10/14, 10/16, 10/20, 10/19 = Avg: 10/17
Virginia Lakes: 10/3, 9/25, 10/3, 10/2, 10/12 = Avg: 10/4
Lundy: 10/17, 10/7, 10/10, 10/12, 10/12 = Avg: 10/12
Lee Vining: 10/10, 10/16, 10/17, 10/20, 10/22 = Avg: 10/15
Bridgeport/TwinLakes: 10/17, 10/18, 10/22, 10/18, 10/24 = Avg: 10/20
Hope Value: 10/7, 10/7, 10/10, N/A, N/A = Avg: 10/8
Tahoe: 10/22, 10/18, 10/18, 10/22, 10/20 = Avg: 10/20
This is exactly what we recommend doing! Thanks for doing the legwork, UncleEbeneezer.
You’re welcome. I like to be prepared. I even went through most of the major campgrounds in these areas (except Hope/Tahoe) and made a spreadsheet of camp-sites in/amongst aspens 🙂 -John/UncleEbeneezer
@UncleEbeneezer
Could you share your prediction for 2024?
Also, do you have updated numbers with 2023 GO NOWs?
If I want to find the GO NOW dates for 2023, how do I find those report links?
Hi Uncle Ebeneezer, to choose where to see fall color at peak, refer to Reports by Month/Year (for when you plan to travel) or Reports by Location (for where you plan to travel). You can find these by simply clicking on a post. When the post pulls up, the report menus should be on the right-hand side. Look back at past years to see when color was peaking and where if you want to plan a trip a few weeks out. California fall color peaks very consistently from year to year, usually within a few days of past recorded average peak. Unfortunately, we do not have a way to pull the GO NOW! posts on their own, but if you choose your location first, you can quickly find the GO NOW posts from that location. Also, prediction post is coming soon! Thank you for reading.
Thanks @Lara Kaylor
I am planning to book hotel for eastern sierra for Inyo (primary) and Mono county fall color. I am torn between 5-6th October vs 12-13th weekend. What would be your recommendation?
I would recommend Oct. 5-6. That is usually a sweet spot, but you should see color either weekend.